Showing posts with label guide. Show all posts

Thursday, 18 November 2021

C++ & SFML // Simple Timer

So I'm currently working my way through making a clone of Space Invaders using SFML and I got to the point where I needed to do something after X amount of seconds. Usually I use FLTK and that would've been simple using it's callback system however SFML is event based and as such doesn't really supply a "timer system" out of the bag like fltk.

Therefore I googled and eventually found pieces of what I was looking for and managed to put this simple demonstration together for those who just want to figure out how to get seconds displayed on the screen. This is what the "tutorial" will give you:

C++ & SFML // Simple Timer displaying seconds passed

The program does 2 things:
1) Display the number of seconds since the program started
2) Every second it chooses a random message (from 4) to display.

Very exciting. Let's begin.

Here is the full code:

Have a look, it's all in main for simplicity. 

There is a clock that is restarted at the beginning of the main loop and assigned to DeltaTime.
SFML have handily provided a way to get the DeltaTime as seconds. All you have to do then is += that to a variable defined outside the loop and you have your seconds since the program started.

For the text, I just made a variable that holds the max time we want to show the text for (maxDelay) and another variable to hold the elapsedTime. Getting the elapsed time is the same as getting the seconds above only when updating which message to display, there is a check to see if the elapsed time has gone above the max delay. If so, it changes the message and resets the elapsed time back to zero.

The concepts here can be used for many other things like displaying a sprite for a given amount of time as well creating more complicated things, like an event queue system that dispatches events based on the elapsed time (much more useful for larger projects than above).

for an example on how this can be put together.

Monday, 14 June 2021

Automated Testing // Adding Google Tests to a C++ Visual Studio Project and How to Use Them

It's starting to get to the point in my exercises for Principles and Practice, that I'm missing important things out because I'm not testing my code properly. This is because 1) I'm lazy, and 2) I'm lazy. At work, we use a variety of unit tests, map tests, asset audits and other things to try and catch code that could break the build if submitted. Granted, some things get through; there will always be edge cases. But for the most part; automated tests can save you a lot of time and sanity.

Creating a Google Test Project

First create a new project using the google framework. I'm using Visual Studio 2019 which has Google Test already integrated. Earlier versions may need it installing via the VS Installer.
Give it a name.

On the next screen you can choose to dynamically link or statically link. I left it on the defaults but you can read about why you might want to change here: https://docs.microsoft.com/en-us/cpp/build/dlls-in-visual-cpp?view=msvc-160


Once your project has opened, you may notice there is no main(). Unit tests don't need a main. You can even link this project to your current one and then import the files you want to test but that's getting ahead. Simply build the project; it should build with no errors. Then open up the test explorer found in View->Test Explorer. I like to dock it to the side where the solution explorer is and you can easily tab between the two.


You need to build it for new tests to show up there. Here it's showing the test "TestName". This simple test expects 1 to be equal to 1 and expects true to be true; difficult stuff. If you run the test by pressing the green arrow in the test explorer you can see that it turns green with a tick as 1 is indeed equal to 1 and true is true.


Let's change this up a bit. I'll make a new test. Here I've added a function that adds numbers together. I'm testing that it works correctly by expecting the appropriate answer. 

I suggest making some simple tests in this project to get used to the different macros within google test. You can read more about those here:
Google actually has some excellent documentation.

Adding Google Test to Your Current Project

Right click on the solution name of the project you're working in. Choose Solution->Add->New Project.

Here scroll down and choose Google Tests. Hit next. Give the project a name and a location. When you hit next this box will appear:

Now you can choose a project to test from the drop down box (very handy).  The best part about choosing the project is that your test project will automagically reference the chosen project; no need to mess about doing it manually.

Your solution explorer will now look something like this:

Now I want to test my code. Currently I'm creating vectors of different types and entering data in the console window whilst the program is running to test different input. But what if I could do this with tests?

To get hold of my header file with the functions I want to test, I'm going to add the solution directory to the test solution. Right click on the Test solution and choose properties.

In here go to C/C++ -> General -> Additional Include Directories -> Edit


Click the folder icon. 3 dots will appear below; click them and navigate to the folder where your project is. Hit ok, then apply and ok again.


Now you should be able to include files from your project without having to give the full directory.

Using Google Test

As an example, I had an exercise to provide input and output operators to std::vector. When I put the code up, I would like others to see the types of tests I've done so they to can try those tests and hopefully it should also make the code easier to understand. Here I want to test that strings with whitespace are correctly read in as one variable instead as pushed back as multiple. I've created 3 test strings and read them into the vector. This should produce 3 entries in the vector:


I then ran the test in the test explorer and it failed with this extremely handy output:

I don't need to do any debugging in the console window now as I clearly know that my input overload function is not reading strings with whitespace as one variable.

Looking at that code I can see why:

It will read into a variable and then push that variable back so long as the stream isn't bad. I can change this now to read into the variable using getline() and use stringstream to convert the string into the correct type. There is another problem though; as this is templated I can't directly convert the stringstream into a string (it will just put 1 word into the variable if I do stringstream >> variable). So I added another overloaded function for string types.


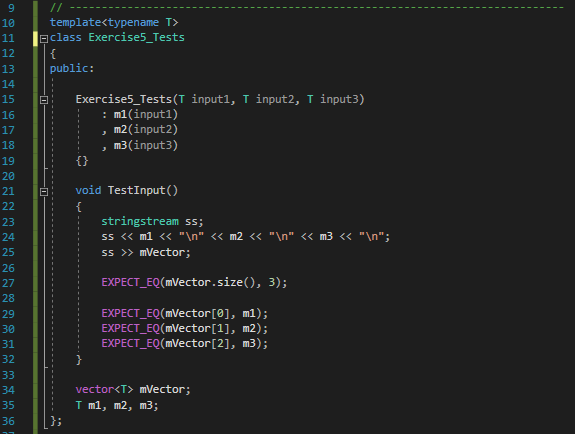
There are lots of other tests I could write for this scenario; ones for integers, ones for chars and floats. All those tests will get repetitive though so you could create a templated test and run those instead. This is quite simple. I just templated my original test and gave it some inputs via the constructor: 

Then created new tests with the different types and input:


This can be streamlined even further with Type Paramatized Tests. These are great for flagging any errors you might get from using a specific type with your code. Setting up a type paramatized test is a faff but it pretty much looks like this:


(Line 40) First, create a fixture class that derives from testing::Test. I left mine empty because I wanted to continue using Exercise5_Tests<> in my tests instead, but you need this base class to define the parametized tests.

(Line 47) You then need to declare that you are creating a type parametized tests suit using a class template.

(Line 49 - 56) Then you define your test. It can be repeated as many times as you want. I only have 1; InputIsCorrect, but you can add another. Just make sure the first parameter matches the name of you base class for this test suite. I added some code as an example.

(Line 58) The tests now need to be registered. You don't need a call to this macro for each test name. If you have more than 1 test you can register them like so:
REGISTER_TYPED_TEST_CASE_P(VectorInputTests, InputIsCorrect, AnotherTest, AThirdTest)

(Line 60 - 61) Let the test suite know what types to run the test with. I supplied int, float and double. So Google test will create 3 versions of InputIsCorrect, replacing TypeParam with one of these types.

My tests are extremely basic and not really worth it but they're useful for learning about google tests and getting used to writing them. One of the hardest parts of my job is not actually writing/creating features but it's testing them. In production code, type parametized tests could catch errors if someone decides to create a templated type with a type it's not supposed to be. Of course that does rely on the user adding that type to the tests....this is where testing fails us sometimes.

A more useful example would be a type of AI in a video game. The AI could all be fundamentally different; a zombie, an NPC or a dog but let's pretend they all inherit an interface that allows them to calculate the players position and move towards them. Instead of writing individual tests for each type, you write one test, call the necessary function (it could be MoveTowardsPlayer()) and observe the output.

// Debugging

If you have written a test and you're not sure why it's failing, you can debug through the test which is extremely useful. Place your breakpoints then right click on the test name in the explorer and choose debug instead of run. It saves a lot of time giving your code what it needs to run instead of having to manually get it into the failing state.

Sometimes this might happen:

I find that building hangs for some reason. I just clean the solution and build again and that usually fixes it.

// Final Comments

Make sure to read the the docs:

They're actually useful. I'd say Google Tests is similar but different enough to the unit tests we use at work but after an evening of tinkering I found the test suite very easy to use. Engines like Unreal have there own testing framework built in; that's the one we use (albeit it's been modified). You can read more about UE4's testing suite here:

And last, here's a great talk from one of our engineers about testing and why you should use it:
Happy testing!

Here's a link to the full test file:

Wednesday, 13 January 2021

C++ - Using NatVis files with UE4 & Visual Studio + WinDbg Funtimes

Story time
Recently at work I was debugging through a dump that had crashed in the TickTaskManger. It's the part of the engine that pretty much handles all the ticks in a frame. An object had recently spawned late in the frame, causing it's tick to be added to the NewlySpawnedTickFunctions container. The problem is that this container is a custom UE4 one known as a TSet. Unreal explains what a TSet is here:
https://docs.unrealengine.com/en-US/ProgrammingAndScripting/ProgrammingWithCPP/UnrealArchitecture/TSet/index.html

It's kind of like a map but instead of a <key, value> pair, the data itself is both key and value. When debugging through it, the only data available to me in the watch window was the LevelList (an array of TickTaskLevels for every level in the world). 

A TickTaskLevel contains a few containers itself, including the NewlySpawnedTickFunctions. When ending the frame, there is an assert to make sure that this TSet is empty, however, one of the TickTaskLevels NewlySpawnedTickFunctions had 1 element. It should've been very easy to see what tick function had added itself late in the frame by just looking at the Target member variable on the TickFunction added to the container. Instead, I was left staring at pointers, padding and random characters.

My manager easily identified what the offending UObject was that was trying to spawn and I was sat there staring at my garbage results like "but how??". Turns out that Visual Studio just had no idea how to display the information in a TSet properly and was doing it the best way it knew how. 

Enter NatVis. I had never heard of this before, there's a great post on it here:

Basically, you create a small XML file that tells VS how to display the custom container. Epic provides an XML file with their custom containers. If you have a code version of UE4 installed you can find this file on your pc around here:
[UE4Root]/Engine/Extras/VisualStudioDebugging/UE4.natvis

You need to copy this file into Visual Studio's visualisers folder. Usually located (but not always) in
C:/Users/You/Documents/Visual Studio Version/Visualizers

Or follow some of the steps below on how to add it to your project directly.

We have a tool that automatically does this for you. It's supposed to do it every time you generate project files but some reason it didn't for me. After this, TSet immediately showed me the offending owner of the tick function (it was a particle...).

Enabling NatVis in Your Own Projects
So the above Microsoft post is really straight forward...if you have debugging tools enabled and you know how to use WinDbg. I apparently did not have debugging tools enabled on my personal PC and I've used WinDbg once at work. I went down a rabbit hole trying to figure out how to follow the "straight forward" post. I eventually figured out what to do from this post:

First go to Apps & Features:

I had a few dev kits installed so I chose the newest one. Click on it and press Modify.


Choose change and then press next.


Tick the Debugging Tools For Windows box and hit change. It will then go and install it.

A Visualizers folder will have now appeared. Mine was located around here:
C:\Program Files (x86)\Windows Kits\10\Debuggers\x64\Visualizers

Now, for me Visual Studio had no problem displaying this type without help but this is some good practice with using WinDbg; the Windows 95 looking memory tracker.

I'm following this tutorial here:

In WinDbg
Open up WinDbg, then File->Open Executable and search for the .exe created when compiling the dog example program from the first link in this post.

In the command line enter:
.symfix
.symfix + (the location of the debug folder of your application)

UE4 C++ - Using Visual Studio's NatVis with UE4 (and your own projects) + WinDbg Funtimes
It will show *BUSY* for a few moments in the bottom left and then symbols will have been loaded for your program.

Next type in:
.reload
bu AppName!main        // you may get a warning after this one about verifying checksum, ignore it
g

WinDbg will now breakpoint into the program at main:
UE4 C++ - Using Visual Studio's NatVis with UE4 (and your own projects) + WinDbg Funtimes

Hit Step Into at the top (or press F11)
UE4 C++ - Using Visual Studio's NatVis with UE4 (and your own projects) + WinDbg Funtimes

Step until MyDog has been initialised. Now, even though I had added the natvis file to the visualizations folder it still didn't understand what to do. Eventually I found a command to make it load a specific natvis file from anywhere:
.nvload {filelocation}
UE4 C++ - Using Visual Studio's NatVis with UE4 (and your own projects) + WinDbg Funtimes

If you type in ??MyDog and hit enter it will show you the contents. It's readable but it could be better. Type the following
dx -r1 MyDog

and WinDbg will show the contents in our nice new readable way!

UE4 C++ - Using Visual Studio's NatVis with UE4 (and your own projects) + WinDbg Funtimes

That's great but WinDbg is kind of a pain and only useful for heavyweight developing. There is a way to add natvis files to Visual Studio.

In Visual Studio
Right click on the project in Solution Explorer and go to add new-> new item.
UE4 C++ - Using Visual Studio's NatVis with UE4 (and your own projects) + WinDbg Funtimes

Go to Visual C++->Utility and choose Debugger visualization file (.natvis)
UE4 C++ - Using Visual Studio's NatVis with UE4 (and your own projects) + WinDbg Funtimes

This will create a basic natvis file for you to add code to. When you run the program and breakpoint; there will be no difference when using the MyDog example but Microsoft gives some pretty good examples of when custom natvis files are useful here:
https://docs.microsoft.com/en-us/previous-versions/visualstudio/visual-studio-2015/debugger/create-custom-views-of-native-objects?view=vs-2015&redirectedfrom=MSDN

It also builds the natvis file into the pdb (symbols) of the project so if you do use WinDbg you don't have to mess around doing the above steps (but now you know how :) ).

Friday, 13 March 2020

Notes on the examples in Chapter 12 Programming:Principles and Practice Using C++

So I've started reading through Chapter 12 and just trying to get the first example shown a page in took me a while. Therefore, I'll be leaving comments and fixes in this post for anyone else who may have struggled.

In order to get the program running in the first place you'll need some files made by Bjarne himself. I spoke about these in a previous post and fixed them up and posted them to my Git. There were a lot of errors as, due to time they have become wildly out of date.

These cleaned up files can be found here:
https://github.com/l-paz91/principles-practice/tree/master/Graphics%20Files

And I wrote about this process in detail here:
https://lptcp.blogspot.com/2020/03/programming-principles-practice-fixing.html

I wrote a guide for installing FLTK here as well:
https://lptcp.blogspot.com/2020/03/how-to-install-fltk-for-use-with.html

12.3 - A First Example pg 415
Due to namespace ambiguity, it's probably best if you avoid using namespace Graph_lib. In the first example in 12.3, Polygon is considered ambiguous and requires Graph_lib even though the using keyword has been set.  That was the only issue I had for the first example.

12.7.3
Initially, the axis drew as light grey on my screen. I tried looking for the definition but I couldn't seem to find where it is initially set to use grey, so I just left it. I then remembered that we're supposed to be hitting "next" after every example to show it building up. The key is to make sure you have win.wait_for_button() after every example. The axis shows as black after that.

I also noticed that the canvas label disappears after the first screen. Odd. (edit 30/09/2020 - I ended up fixing this here: https://lptcp.blogspot.com/2020/08/notes-on-chapter-15-principles-practice.html)

12.7.5 - 12.7.6
Both Rectangle and Polygon will need their scope (Graph_Lib) when using them. Even if you have using namespace Graph_lib;

12.7.7
The green shade is much brighter than the one printed.

12.7.10
Ellipse also needs Graph_lib::

You can find the full code and images I used here:
https://github.com/l-paz91/principles-practice/tree/master/Chapter%2012/Examples

Thursday, 12 March 2020

Programming: Principles & Practice - Fixing Files for Chapters 12

Chapter 12 had quite a bit of setup to get it working (and to be able to complete the exercises). Bjarne never actually mentions that you need to download extra files in order to get his examples working. He says at the start of the exercises "you need these" but doesn't give any other information. You can find the custom classes he's created here:

Not all of these are necessary for the graphics chapters. I have a few notes on getting them to compile though as they are hilariously outdated and the internet only turned up bits and pieces for working versions, so I begrudgingly spent an entire evening going through every bloody error. You can find the cleaned up versions on my github however, in the interest of knowledge, try going through and fixing the files.

1 - There are 2 Gui.h (one is all capitals). Use the uppercase GUI.h.

2 - Simple_window.cpp relies on a custom constructor for the next_button(Point()) member. This has been commented out in the code. In Point.h un-comment the two commented out constructors.

3 - Graph.cpp is a red mess.

  • Include Window.h at the top. 
  • Around line 316, change bool can_open to ifstream can_open.
  • In Graph.h add #include <FL/fl_draw.H> and <FL.Fl_Image.H> for reasons. And yes, the f and the is lowercase for some absurd reason and one contains a slash, the other a dot....
4. Simple_Window has two versions of wait_for_button(). In Simple_window.h change void wait_for_button() to void wait_for_button_modified(). Then add  bool wait_for_button();  above it. (This is because, at the time of writing this, I'm not sure if the modified version will be used at some point).

5. Simple_Window has two definitions for it's constructor. Delete the one in the header file and replace it with:
  • Simple_window(Point xy, int w, in h, const string& title);
6. Window is the Windows handle for a hwnd, files are not happy about this. Put all the code in namespace Graph_lib {code here} for the following files:
  • Simple_Window.h
  • Simple_window.cpp
7. Simple_window...again. 
  • next() already has a body. Delete the body from the .h file so it just reads void next();
  • cb_next() also already has a body. Delete the one in the cpp file as, with a quick glance, the one in the header looks safer; pointer usage wise that is.
8. They're not errors but all the mismatch warnings are annoying me. Regardless of how annoying they are, the phrase "if at first you don't succeed, #pragma disable warning" is not the approach to take...(as much as I want to). Where it says '<' signed/unsigned mismatch; changed the int to unsigned int (or remove the unsigned) till the warnings go away. 

There are two more warnings on Graph.cpp warning about conversion from double to int...seeing as how Point only uses ints I'm guessing floating point maths is not allowed so I wrapped the second part in a static_cast<int>(u.first*(p2.x - p1.x)); etc. 

9. Only two errors left. Graph_lib::Menu::Menu(...) already has a body (of course it does). Delete the one in the cpp file (they're the same...practically). And fixing that fixed the last error and it builds...YEAHHH.


Alright, I think that will do for the evening. I've been sat here for 2 hours just trying to do the bloody example a page into the chapter. 

Full code files:

EDIT 14/12/2020
I've just realised, I never posted the original cleaned up version of SimpleWindow.cpp...Whoops. I never saved the original copies but over Christmas break I'll fix up a new copy.

EDIT 01/01/2021
The link to Bjarne's original files above no longer works...It took me a good 10 minutes to navigate his website and realise that the old files are now provided as a zip file here:

He notes that they were recovered from the loss of his previous website which must've gone down sometime last year. These new files are slightly different to ones I downloaded; they appear to be newer. This batch does not contain a Simple_window.cpp as everything is defined in the header:

Wednesday, 11 March 2020

How To Install FLTK For Use With Programming: Principles & Practice Using C++

There are instructions at the back of the book (page 1204) on how to install FLTK however, these are for use with 1.1.x.

FLTK advises users to no longer use the 1.1.x versions of FLTK anymore as they won't compile on most modern computers. This is true. 1.1.10 would not compile on my pc (some of the files were from 2003...)

Instead of copying the lib files to the VS folders I have documented how I would usually include a library into a project. You can use steps 6 onwards, to include any library. I normally use DirectX9.

1. Download the latest stable release from here:
https://www.fltk.org/software.php

(I usually download the tar.gz version).

I'm using 1.3.5 in these exercises.

EDIT 07/10/2021 - I followed these steps using the latest version of 1.3.7 and it worked fine.
EDIT 12/02/2023 - Followed these step using the latest version of 1.3.8 and works fine.
EDIT 30/04/2024 - Followed these steps using the latest version of 1.3.9 with Visual Studio 2022 and it works fine. I did have to change my build mode to x86 though with VS2022.

2. Unzip the file (you may need to do this twice depending on what zip programs you have installed).

3. Within the FLTK folder, navigate to ide -> VisualC2010 and open the fltk Visual Studio Solution. For me this opened automatically using VS2017.

4. VS will ask you to re-target the solution. Just click ok.


5. Build the solution. This will take a few minutes. When you include FLTK in your solution now, you won't have to recompile the library every time you build. (Building in Win32 Debug mode is fine for debugging. If you want release, build in release). You can then close the solution.

6. Open up the VS solution you wish to work in. Right click on the solution name in the explorer and select properties.


7. Click on VC++ Directories. Click on Include Directories and the arrow that appears on the right and then edit.


8. Click on the new folder icon at the top, then the three dots that appear. Navigate to the folder on your pc where fltk is. Click Select Folder and the press OK.

9. Repeat steps 7 & 8 but with the the Library Directories.


Press Apply and then OK. Normally you would choose the separate folders for each. For example, the include directories would be the include folder and the libraries would be the library folder. However, FLTK itself uses the FL/... structure so if you do this you will find that your program will fail to build with an error like so:

EDIT: I didn't realise I had done this on my own PC until these steps failed to work on my work pc; I had added additional dependencies in Linker. In the Library Directories section, please also include the lib folder of FLTK. Or you can leave it the way it is and add the folder to the additional dependencies like so:


10. Go to the properties again but this time navigate to Linker -> Input -> Additional Dependencies. Click the arrow, then edit and add these on new lines  in the top box (ignore the top one):

Click OK. The on the end of each library is for the debug builds. If you want to build a release version you will need to use different libraries.

Edit 07/10/2021 - If you'd like to add png images to your builds, add fltkpngd.lib

11. Write down the sample code, build and run. You should get a pop up window:


Other errors you may encounter:
- "Fatal error LNK1104: cannot open file 'fltkd.lib'
I got this error when doing the above steps on my work pc.  Depending on your computer you may need to change step 9 to directly include the file path of the libraries. For example it would be FLTK->fltk 1.3.5->lib. (or you can just add the folder to the additional library dependencies in Linker).

EDIT 01/01/2021
I've now added a zip file to github containing a full program for this exercise: