Story time
Recently at work I was debugging through a dump that had crashed in the TickTaskManger. It's the part of the engine that pretty much handles all the ticks in a frame. An object had recently spawned late in the frame, causing it's tick to be added to the NewlySpawnedTickFunctions container. The problem is that this container is a custom UE4 one known as a TSet. Unreal explains what a TSet is here:
https://docs.unrealengine.com/en-US/ProgrammingAndScripting/ProgrammingWithCPP/UnrealArchitecture/TSet/index.html
https://docs.unrealengine.com/en-US/ProgrammingAndScripting/ProgrammingWithCPP/UnrealArchitecture/TSet/index.html
It's kind of like a map but instead of a <key, value> pair, the data itself is both key and value. When debugging through it, the only data available to me in the watch window was the LevelList (an array of TickTaskLevels for every level in the world).
A TickTaskLevel contains a few containers itself, including the NewlySpawnedTickFunctions. When ending the frame, there is an assert to make sure that this TSet is empty, however, one of the TickTaskLevels NewlySpawnedTickFunctions had 1 element. It should've been very easy to see what tick function had added itself late in the frame by just looking at the Target member variable on the TickFunction added to the container. Instead, I was left staring at pointers, padding and random characters.
My manager easily identified what the offending UObject was that was trying to spawn and I was sat there staring at my garbage results like "but how??". Turns out that Visual Studio just had no idea how to display the information in a TSet properly and was doing it the best way it knew how.
Enter NatVis. I had never heard of this before, there's a great post on it here:
https://docs.microsoft.com/en-us/windows-hardware/drivers/debugger/native-debugger-objects-in-natvis
Basically, you create a small XML file that tells VS how to display the custom container. Epic provides an XML file with their custom containers. If you have a code version of UE4 installed you can find this file on your pc around here:
[UE4Root]/Engine/Extras/VisualStudioDebugging/UE4.natvis
You need to copy this file into Visual Studio's visualisers folder. Usually located (but not always) in
C:/Users/You/Documents/Visual Studio Version/Visualizers
Or follow some of the steps below on how to add it to your project directly.
We have a tool that automatically does this for you. It's supposed to do it every time you generate project files but some reason it didn't for me. After this, TSet immediately showed me the offending owner of the tick function (it was a particle...).
Enabling NatVis in Your Own Projects
So the above Microsoft post is really straight forward...if you have debugging tools enabled and you know how to use WinDbg. I apparently did not have debugging tools enabled on my personal PC and I've used WinDbg once at work. I went down a rabbit hole trying to figure out how to follow the "straight forward" post. I eventually figured out what to do from this post:
First go to Apps & Features:
I had a few dev kits installed so I chose the newest one. Click on it and press Modify.
Choose change and then press next.
A Visualizers folder will have now appeared. Mine was located around here:
C:\Program Files (x86)\Windows Kits\10\Debuggers\x64\Visualizers
Now, for me Visual Studio had no problem displaying this type without help but this is some good practice with using WinDbg; the Windows 95 looking memory tracker.
I'm following this tutorial here:
In WinDbg
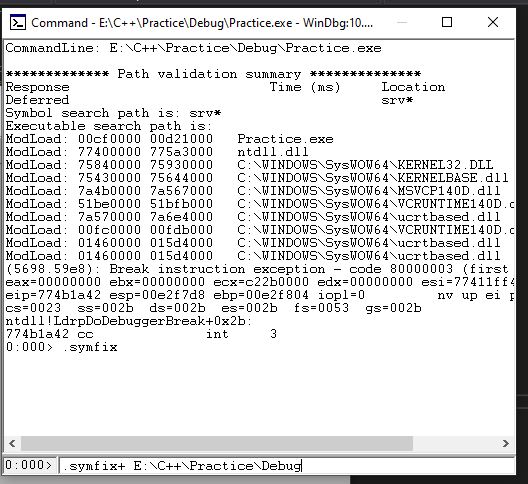
Open up WinDbg, then File->Open Executable and search for the .exe created when compiling the dog example program from the first link in this post.
In the command line enter:
.symfix
.symfix + (the location of the debug folder of your application)
Next type in:
.reload
bu AppName!main // you may get a warning after this one about verifying checksum, ignore it
g
WinDbg will now breakpoint into the program at main:
.nvload {filelocation}
dx -r1 MyDog
and WinDbg will show the contents in our nice new readable way!
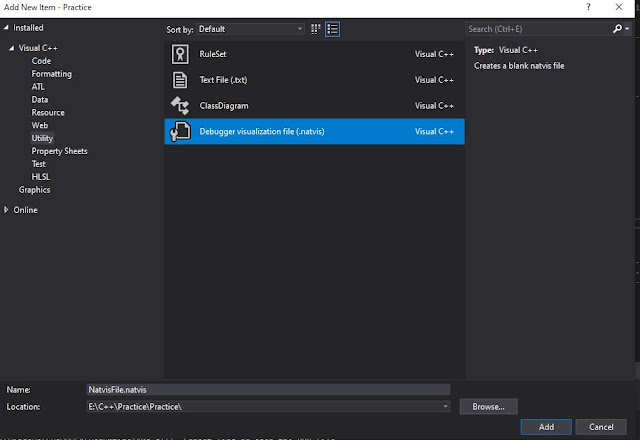
Go to Visual C++->Utility and choose Debugger visualization file (.natvis)
This will create a basic natvis file for you to add code to. When you run the program and breakpoint; there will be no difference when using the MyDog example but Microsoft gives some pretty good examples of when custom natvis files are useful here:
That's great but WinDbg is kind of a pain and only useful for heavyweight developing. There is a way to add natvis files to Visual Studio.
In Visual Studio
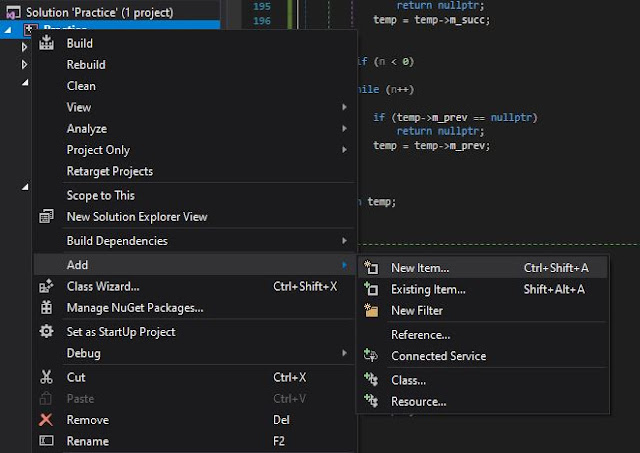
Right click on the project in Solution Explorer and go to add new-> new item.
https://docs.microsoft.com/en-us/previous-versions/visualstudio/visual-studio-2015/debugger/create-custom-views-of-native-objects?view=vs-2015&redirectedfrom=MSDN
It also builds the natvis file into the pdb (symbols) of the project so if you do use WinDbg you don't have to mess around doing the above steps (but now you know how :) ).


No comments:
Post a Comment